The median sales price for single-family homes in San Francisco for May 2015 was $1,400,000. This represents an increase of 28.4%, or $309,500 compared to May 2014. Condos have seen a $185,000 increase in median sales price, or 19.7%, to $1,125,000 for the same period. Average days on market has remained very low with a further decrease crease from 26 to 23 days for single family homes; and a slight increase from 29 up to 32 days for condos. This isn’t surprising as the pressure of low inventory continues to have an impact on both sales price and time on market.
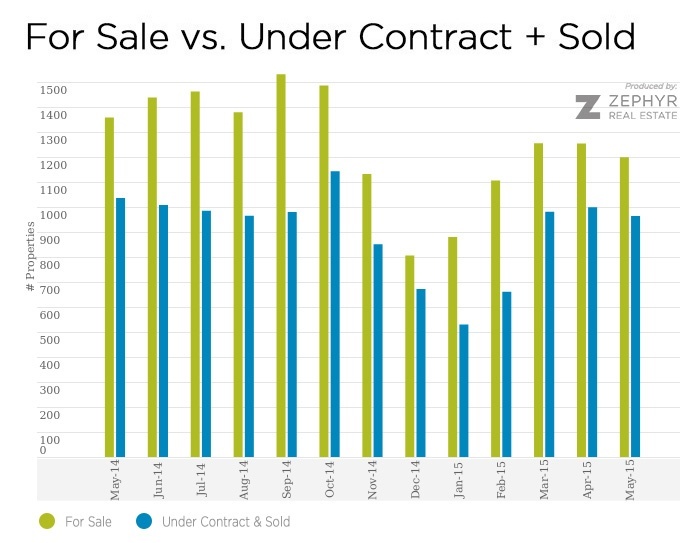
Speaking of inventory, there were 1,199 homes for sale (single-family and condos combined) during the month of May, which represents a decrease of 11.7% compared to the same month last year. Homes continue to sell quickly and often above asking price as well, with single family homes selling at 110% of original price and condos selling at 109.2% of original asking price.
For more details on your specific neighborhood, please contact SellingSF.
SF Real Estate May Numbers
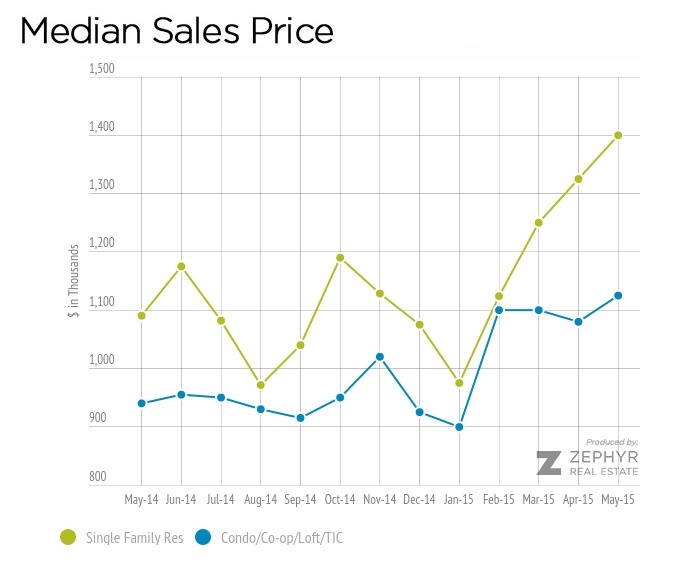
Median Sales Price has seen significant increases year-over-year for both condos and single-family homes.
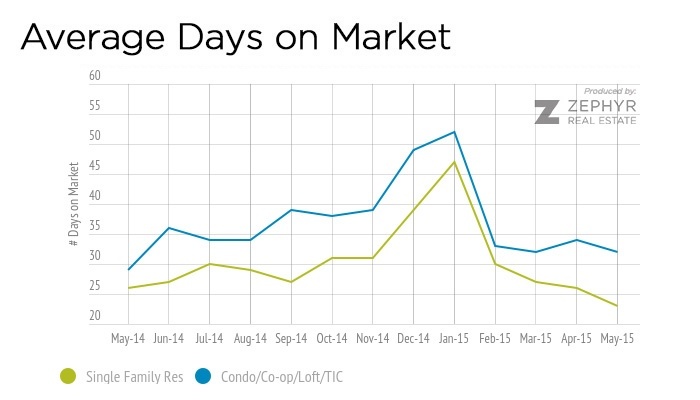
Average days on market peaked during the slower winter months, but has come back down to very low levels.
The above chart combines single-family homes, condos, co-ops, lofts and TIC units.
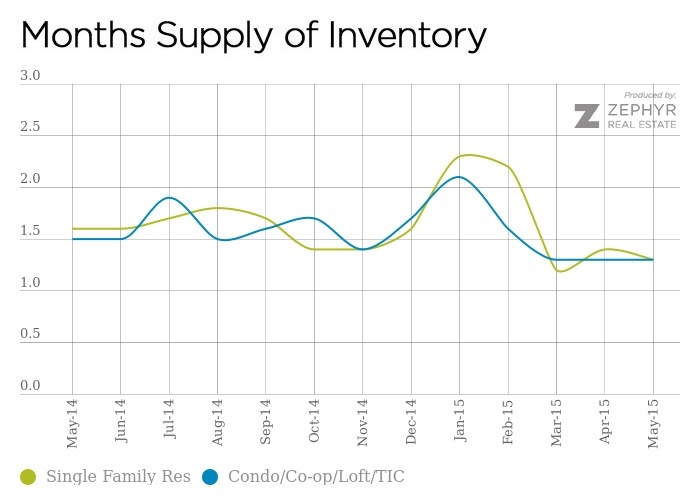
Months Supply of Inventory (MSI) is a measure of the number of months it would take the current inventory of available homes to sell out given the current rate of sale. This metric is often impacted by low inventory.
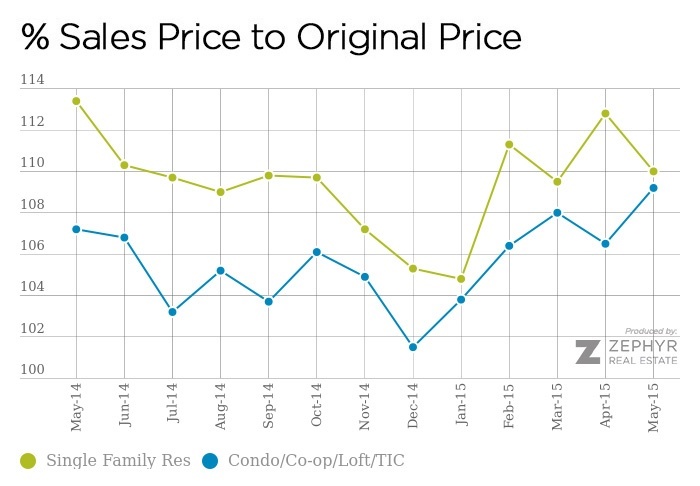
This chart shows the sales price as a percentage of the original asking price. It does not include properties that underwent one or more price reductions.
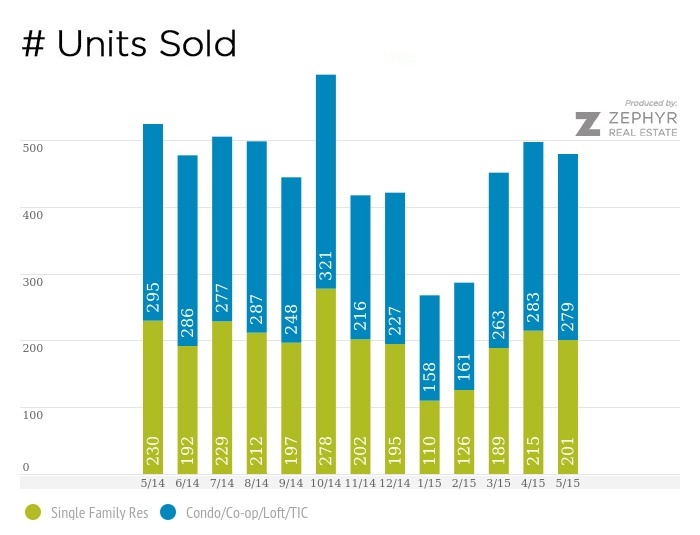
Sales have picked up a bit for Spring after the slower winter months.
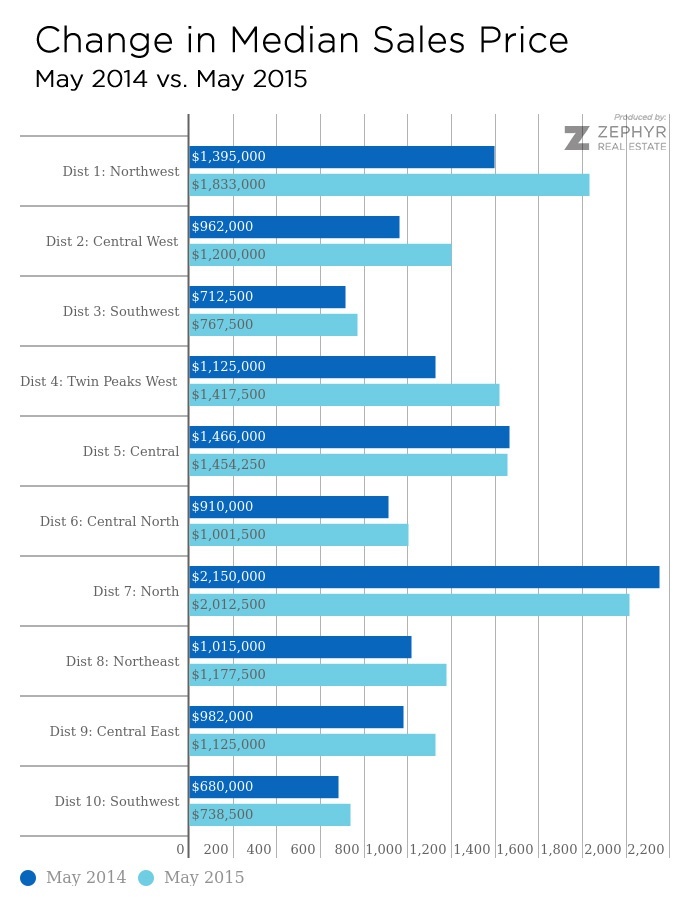
Prices vary widely across the City. Most districts have seen a year-over-year increase comparing May 2015 to May 2014.
District Definitions: 1: Jordan Park/Laurel Heights, Lone Mountain, Lake Street, Sea Cliff and all Richmond. 2: All Sunset, all Parkside and Golden Gate Heights. 3: Stonestown, Pine Lake Park, Merced Manor, Ingleside Heights, Oceanview. 4: Sunnyside, Miraloma Park, St. Francis Wood, West Portal, Diamond Heights. 5: Noe Valley, Glen Park, Eureka Valley/Dolores Heights, Haight Ashbury, Mission Dolores. 6: Lower Pacific Heights, Western Addition, Hayes Valley, NOPA, Alamo Square. 7: Marina, Cow Hollow, Pacific Heights, Presidio Heights. 8: Van Ness/Civic Center, FiDi, Nob Hill, Russian Hill, North Beach. 9: SOMA, South Beach, Potrero, Bernal, Inner Mission. 10: Bayview, Portola, Excelsior, Crocker Amazon, Silver Terrace.
The San Francisco real estate market is highly nuanced. There is wide variance in median price, time on market and inventory from neighborhood to neighborhood. Further than that, some neighborhoods even have varying levels of demand and buyer-interest based on micro-hoods, which can just be a few blocks apart. To get a thorough analysis of what’s happening in your neighborhood and how it impacts your own property’s value, please contact SellingSF.